

Three perspectives
Sales, operational finance, and leadership look at different numbers on different cadences. Separate views and KPI definitions reduce chaos and disputes over “one version of the truth”—without a single dashboard for everyone.
Capabilities · reports
Instead of one overloaded dashboard, we build reports for each audience: sales, operational finance, and leadership see their numbers—on the same auditable data layer.
Three areas
Sales, billing and finance — separate views and KPIs on a shared data layer.
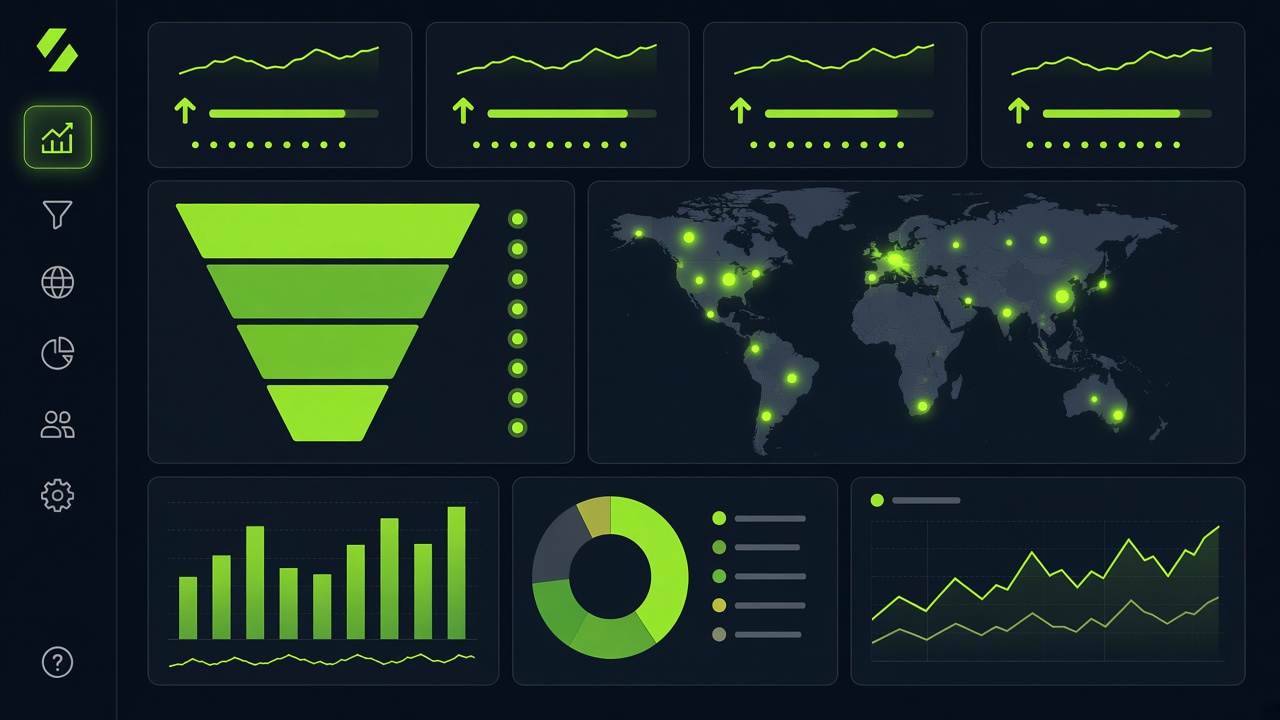
Conversions, pipeline, forecast, and views for sales managers — from CRM and integrations, not manual exports.…
Details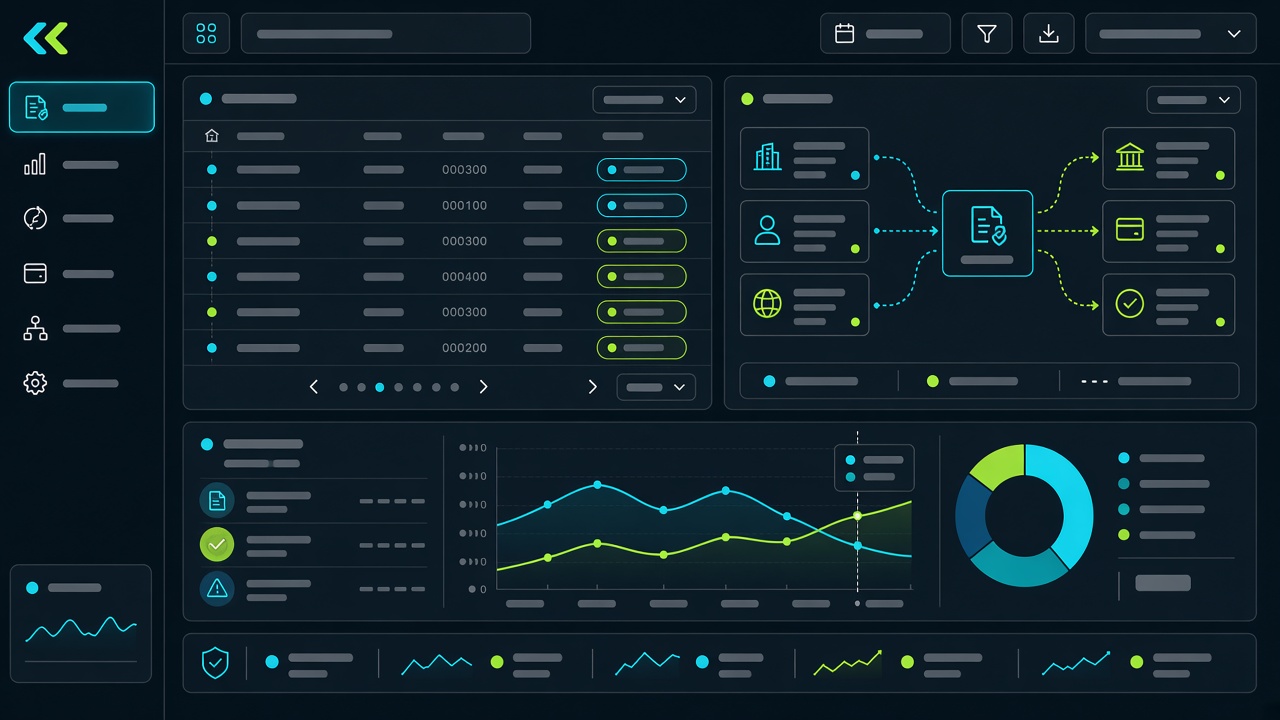
Payment gateway alignment, PSP fees, settlement cycles, and correction trails — reports for operational financ…
Details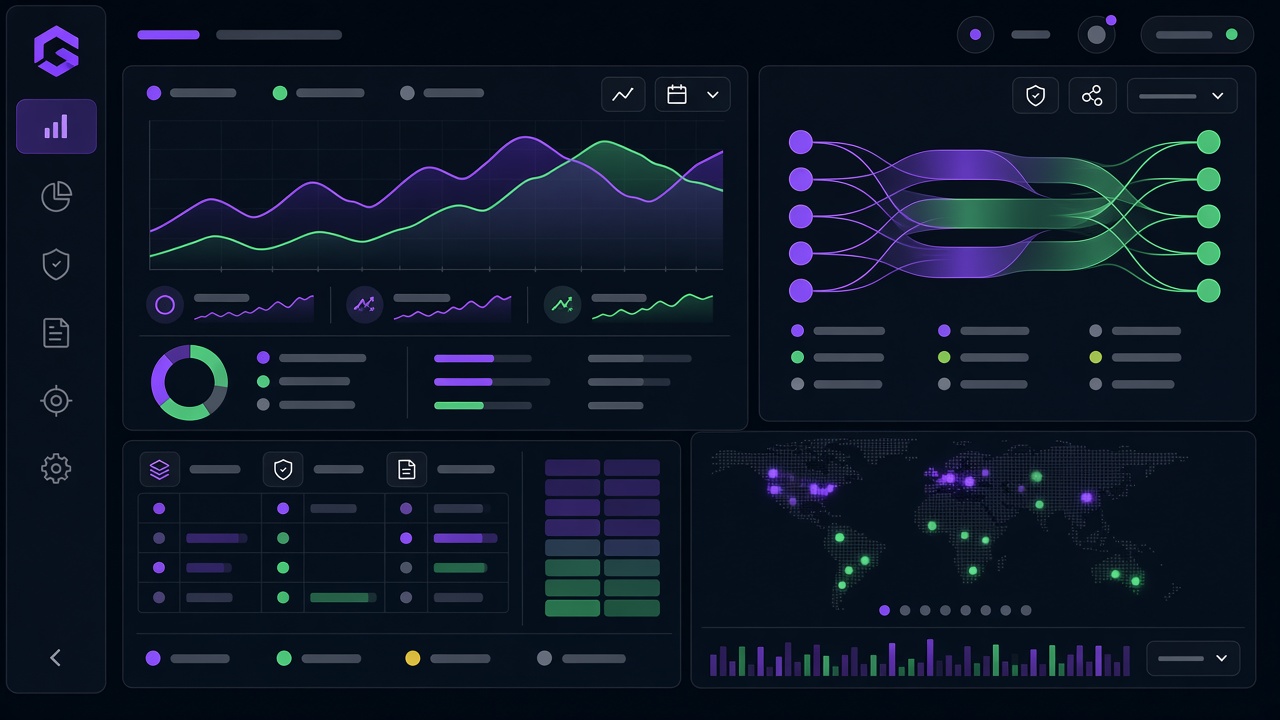
P&L views, operational cash flow, budget variances, and audit trail — for CFO and leadership on consistent dat…
DetailsSales, operational finance, and leadership look at different numbers on different cadences. Separate views and KPI definitions reduce chaos and disputes over “one version of the truth”—without a single dashboard for everyone.
Refresh schedules, permissions, and alerts are designed once; we align SQL models and data quality with the analytics team—so metrics like revenue or margin mean the same thing company-wide and hold up in audit.
One “must have” report for one audience (e.g. pipeline for the sales manager), demo on live data, feedback, then expansion of the metrics dictionary. We avoid months of specification with no visible value.
Sales, settlement, and financial reports are developed as separate pages—shared architecture, different views. The data layer and integrations are described under SQL and API.
Not sure where to start? We will define the first KPI iteration together. info@tensorfrog.it
All capabilities